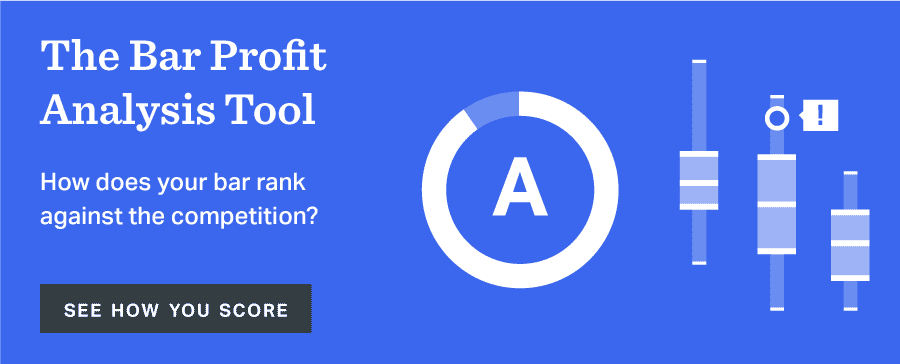

When you’re looking at your bar’s sales and inventory reports, there are areas where you can immediately analyze the health of your beverage program. You can see whether or not your bar is actually profitable. You can also see what items are making you the most profit, and where there is room for improvement. However, one thing you won’t know without looking at outside data is how your establishment is doing compared to industry standards. Your bar or restaurant might be profitable, but is this level of profit where you should be? Or are you seriously underperforming compared to your peers? This is where BevSpot’s new Bar Profit Analysis Tool comes in.
When evaluating the success of your beverage program, it’s important to understand what to compare and what the comparisons actually mean for your bar. Here are some metrics the Bar Profit Analyzer will benchmark your bar against.
One of the first areas for comparison is sitting inventory. Of course, each establishment will have their own protocols and standards for how much inventory should be on hand on a weekly basis. And the optimal levels of sitting inventory will also vary depending on the type of restaurant or bar you’re running, as well as the type of inventory you’re measuring.
However, the most successful and efficient bars we work with generally have the lowest levels of sitting inventory. These bars will have the most capital on hand and won’t needlessly invest in unmoved product.
Another inventory data point to consider when benchmarking with other bars is usage. This is a key point to track in order to see if individual product performance is lining up with the rest of the industry. If you’re finding that your performance levels are off compared to other bars or restaurants, then, even if it is a top-seller for you, this can be a good indicator that you’re not using the product to its fullest potential.
There are many aspects of your sales data that could be used as areas for benchmarking. One example for bars would be their pour cost. Pour costs help measure how much profit you’re making on your drink menu, and controlling your pour cost is an essential technique for powering a successful bar.
As one might expect, there are different standards of pour costs for different types of beverages—whether it be wine, beer, cocktails or spirits. They can also differ depending on the types of beverages you sell the most of. But understanding how you compare to your peers can show you areas to target and improve.
Another area to focus on in terms of bar profitability is variance. Knowing the industry standards for product variance can help you gauge whether you are wasting too much product or missing a lot of product. This information will help guide you in making smarter management decisions, whether it be tightening up on wasted product or actively investigating product theft.
Benchmarking is an essential aspect of managing your sales and inventory data in order to get the most of out it. It’s always important to measure your bar’s data under the right context. Keeping tabs on the latest industry standards, or using tools to track your restaurant’s performance, can give you peace of mind moving forward and show you the right areas to focus on for your business.
See how the new Bar Profit Analysis Tool can help you find out where your bar stands in the industry.